MECHANICAL FINDER CLINIC は先進医療「定量的CTを用いた有限要素法による骨強度予測評価」*向けに開発されたバージョンです。解析対象を大腿骨、椎体に限定し、なるべく自動化することで、解析を容易にし、再現性を高めています。解析方法は屍体骨を用いて実証実験を行った文献1), 2)に従っています。
*2018/03/31をもって先進医療から外れています
骨強度解析の流れ
DICOMデータを読み込んだ後、下記(大腿骨の例)のように比較的少ない操作で解析結果が得られます。
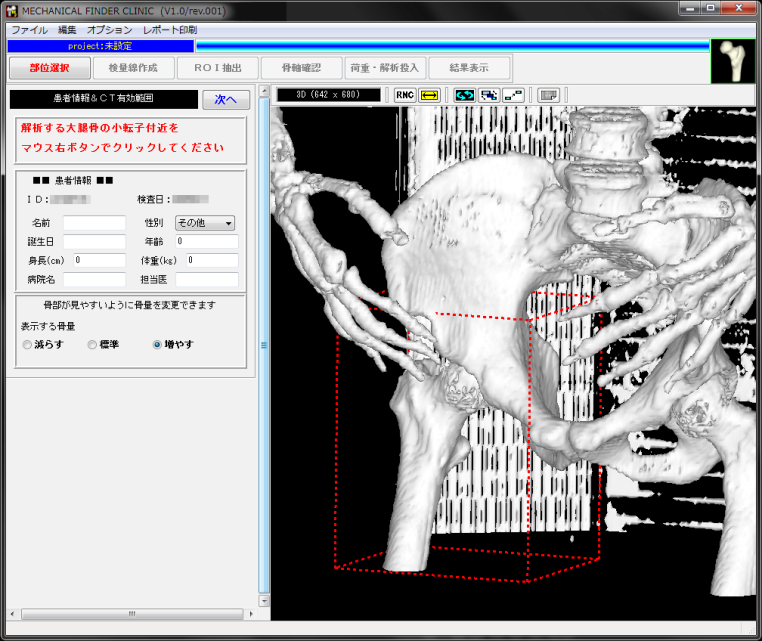
大腿骨を含む範囲を指定します。
小転子をクリックすることで、自動的に範囲指定されます。
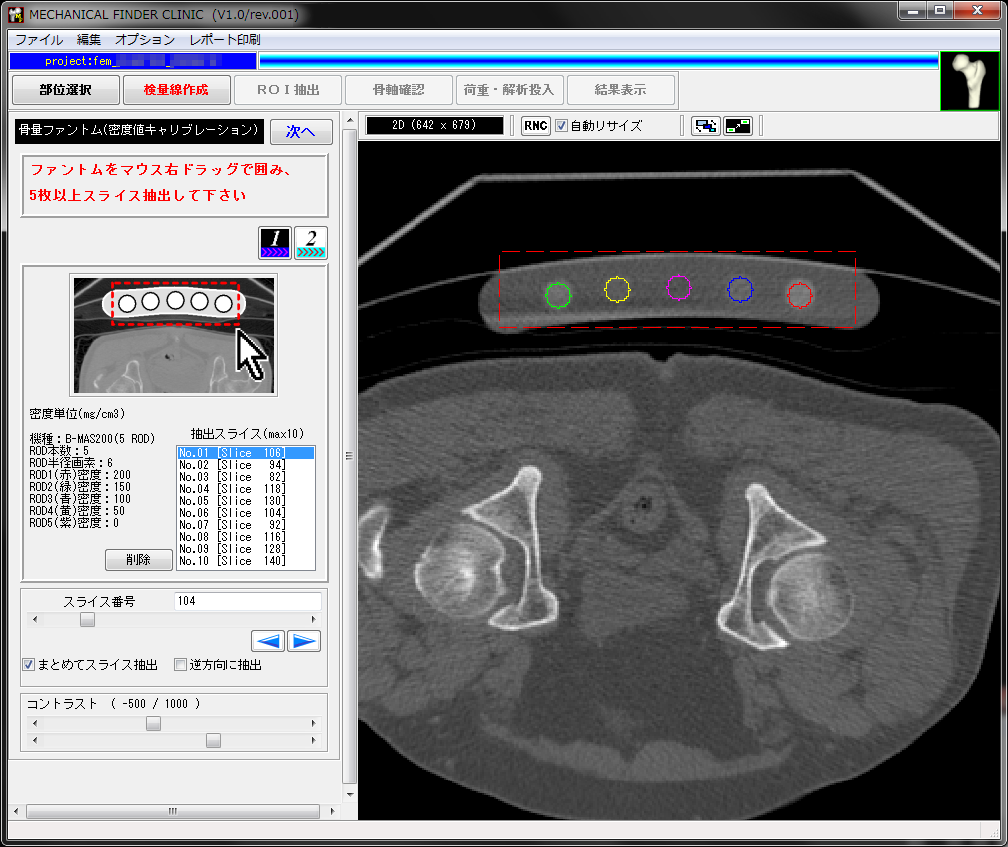
骨塩定量ファントムを用いてCT値のキャリブレーション用の換算式を作成します。
ファントムのロッドをマウスで囲めば自動的に換算式が設定されます。
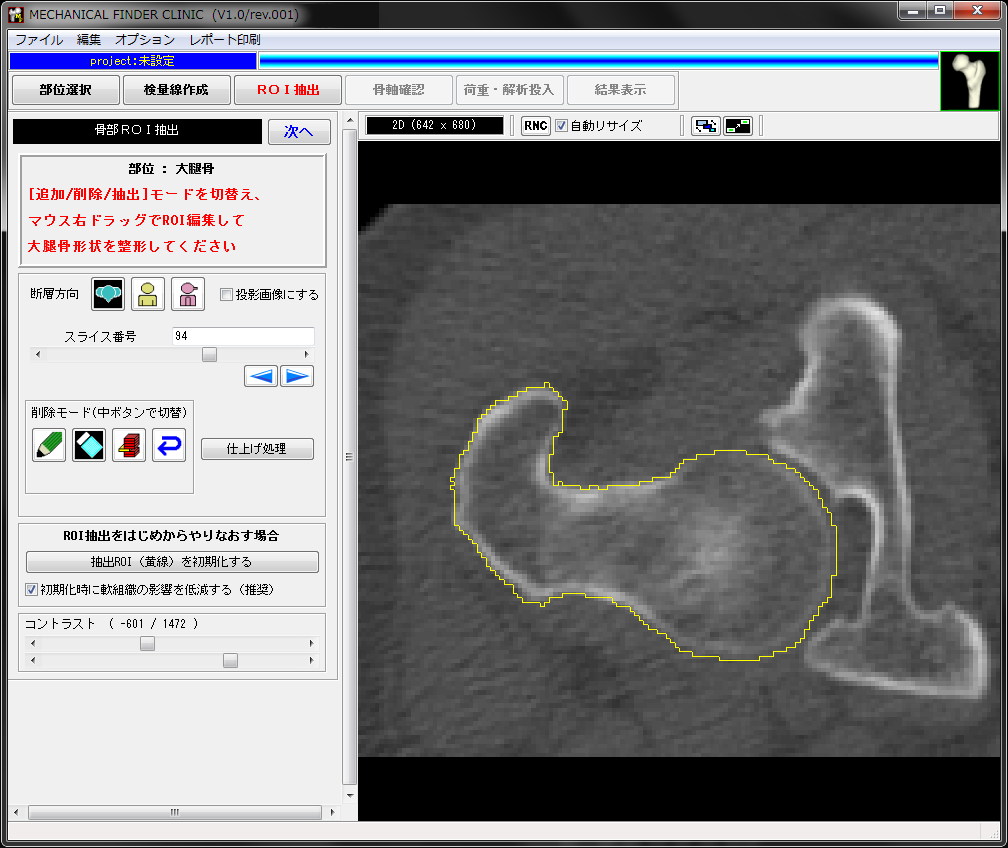
解析対象の骨形状を抽出します。
骨盤を大腿骨から切り離すなど、半自動的に抽出が行われますので、細かい部分を手動で修正します。
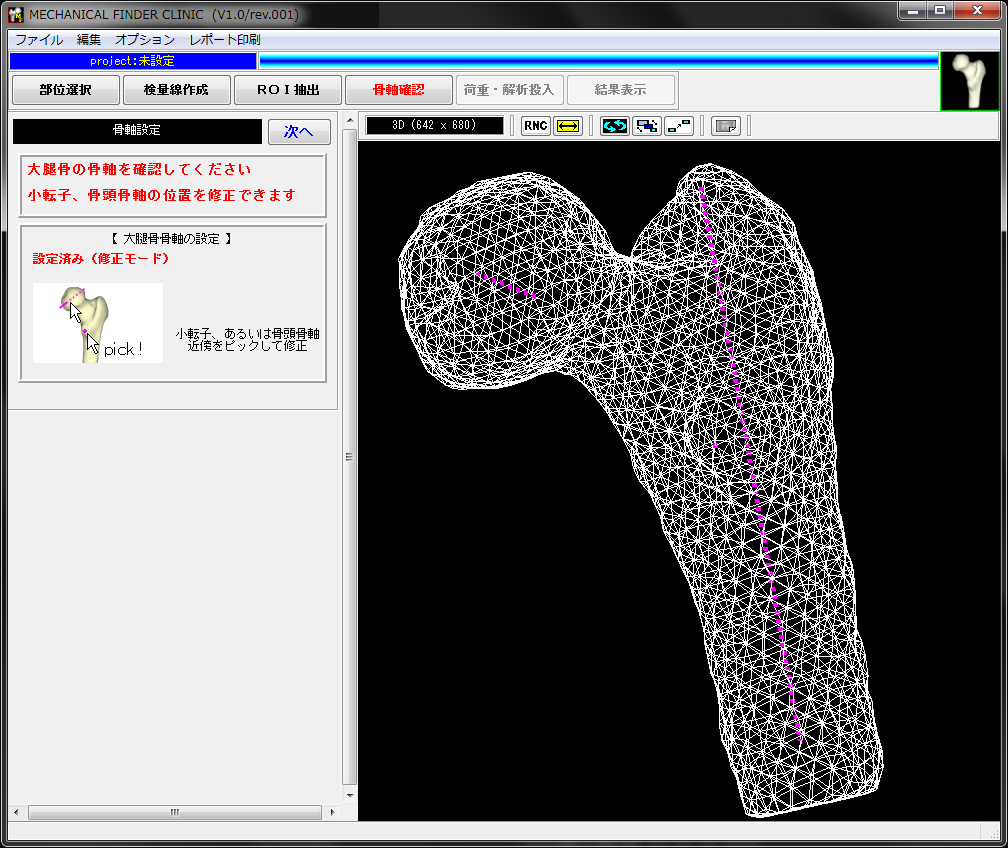
ROIから外形状が生成されるので、荷重方向の基準となる骨軸を設定します。
自動的に骨軸は設定されますので、修正がなければそのまま次に進みます。
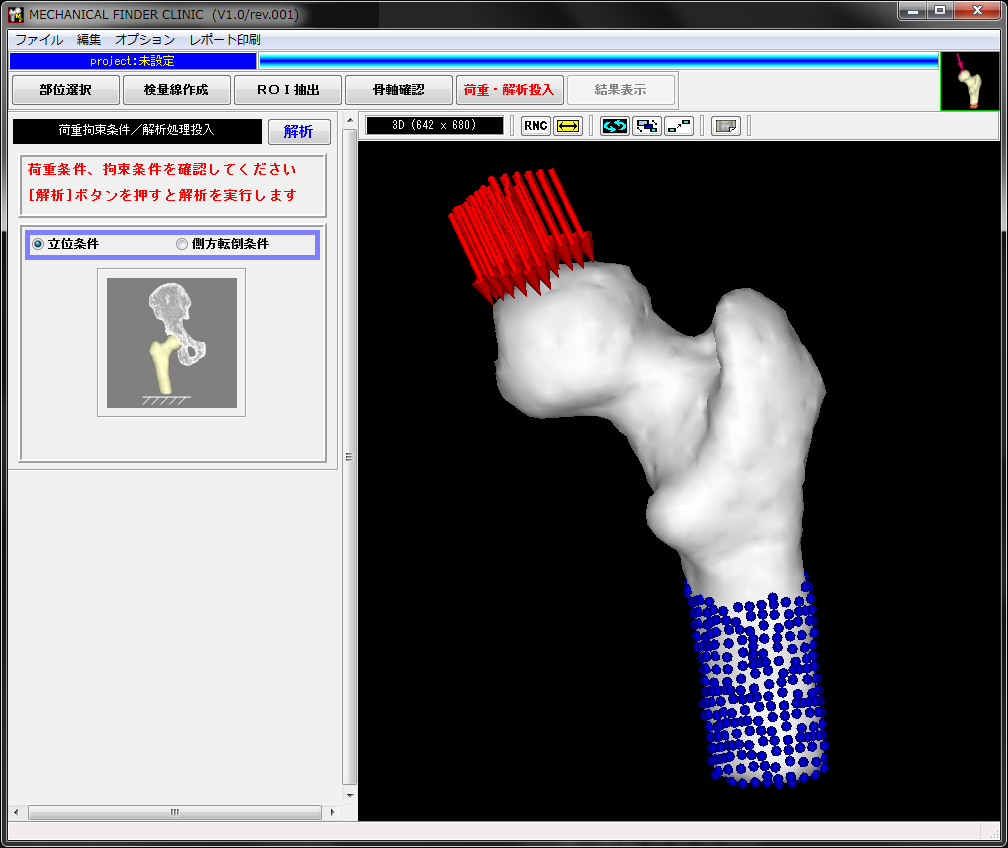
自動的に設定される荷重・拘束条件を確認し、「解析」ボタンを押すと、バックグラウンドで解析が始まります。
解析結果はプロジェクトとして保存され、患者IDで管理されます。
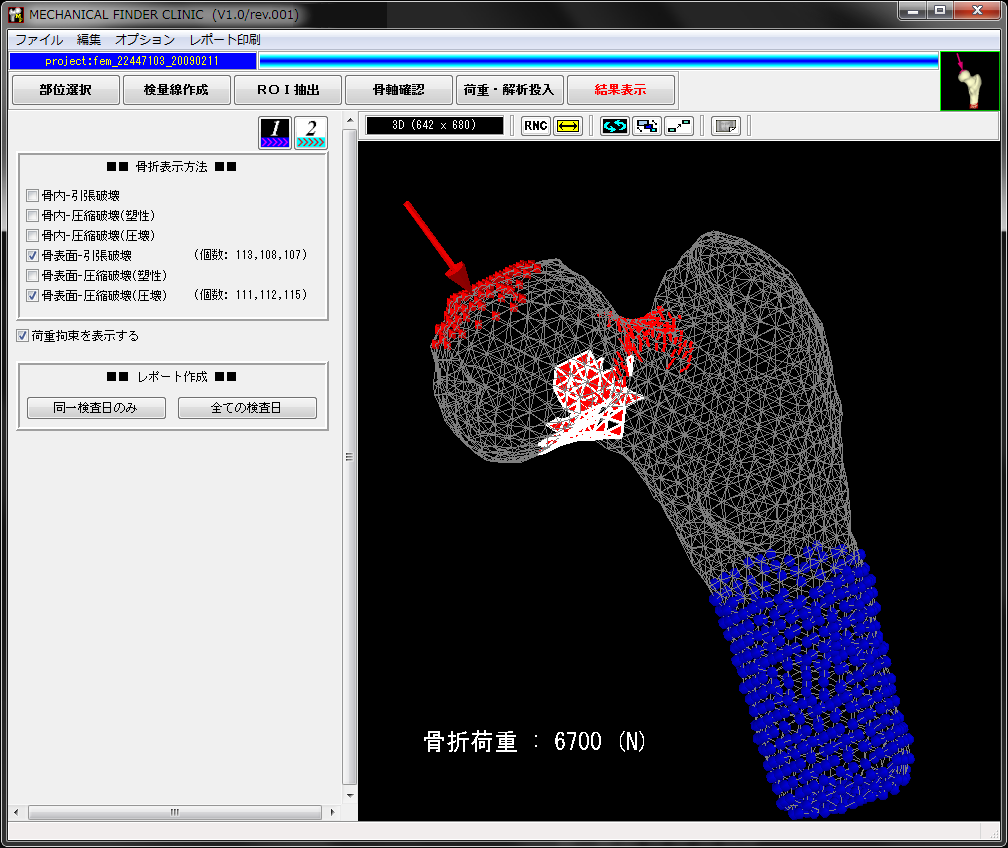
解析済みのプロジェクトを開くと、骨折図や骨折荷重を表示できます。
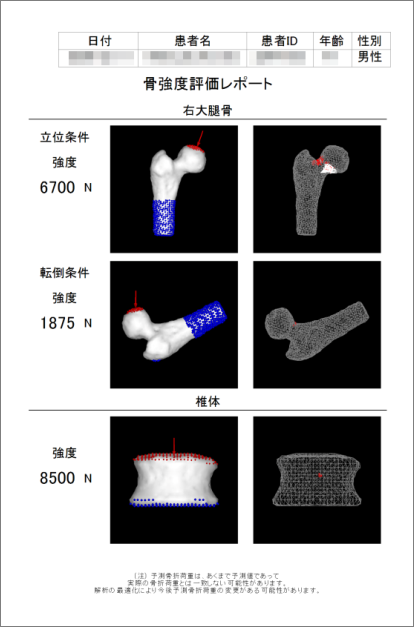
骨強度解析の結果を患者IDごとにレポートとして出力することができます。
関連論文
1) Imai K, et al. Nonlinear Finite Element Model Predicts Vertebral Bone Strength and Fracture Site. Spine (Phila Pa 1976). 31(16):1789-94. 2006
2) Bessho M, et al. Prediction of strength and strain of the proximal femur by a CT-based finite element method. Journal of Biomechanics. 40(8): 1745-1753. 2007
3) Imai K, et al. In vivo assessment of lumbar vertebral strength in elderly women using CT-based nonlinear finite element model. Spine, 33: 27-32. 2008
4) Bessho M, et al. Prediction of proximal femur strength using a CT-based nonlinear finite element method: Differences in predicted fracture load and site with changing load and boundary conditions. Bone 45 (2009) 226-231
5) Imai K. Vertebral fracture risk and alendronate effects on osteoporosis assessed by a computed tomography-based nonlinear finite element method. Journal of Bone and Mineral Metabolism. 29(6): 645-651. 2011
6) Kaneko K, et al. Prediction of proximal femur strength by a quantitative computed tomograpy-based finite element method -Creation of predicted strength data of the proximal femur according to age range in a normal population and analysis of risk factors for hip fracture. Journal of Bone & Joint Surgery, British Volume. 93-B(SUPP II 216): 2011
7) Kaneko M, et al. Predictiong vertebral bone strength with a quantitative computed tomography-based finite-element method -creation of strength data according to age range in a normal population and analysis of factors affecting strength. Journal of Bone & Joint Surgery, British Volume. 94-B(SUPP XXXVII 63): 2012
8) Imai K. Analysis of Vertebral Bone Strength, Fracture Pattern, and Fracture Location: A Validation Study Using a Computed Tomography-Based Nonlinear Finite Element Analysis. Aging and Disease. 6(3): 180-187. 2015
9) Kaneko M, et al. Prediction of proximal femur strength by a quantitative computed tomography-based finite element method–Creation of predicted strength data of the proximal femur according to age range in a normal population. Modern Rheumatology. 26(1): 151-155. 2016
仕様
推奨動作環境
| OS | Windows 8 / 10 (64bit) |
| CPU | Intel x86系および互換、Intel 64準拠 |
| メモリ | 4GB以上 |
| グラフィクス | フルカラーグラフィックスボード OpenGL対応 |
| ディスプレイ | 解像度 1280×1024以上 |
CT撮影時必須環境
| 骨塩定量ファントム | 京都科学製 B-MAS200型、QRM製 QRM-BDC のいずれか (QRM-BDCのご購入についてはこちらよりお願いします。) |
仕様
推奨動作環境
Windows 8 / 10 (64bit)
Intel x86系および互換、Intel 64準拠
4GB以上
フルカラーグラフィックスボード
OpenGL対応
解像度 1280×1024以上
